Seven search trees
One ordered set, seven maintenance strategies. Compare evolving structure, mean lookup depth and structural edits under identical input—then connect those local choices to the beachline trees in Fortune.
Explore connections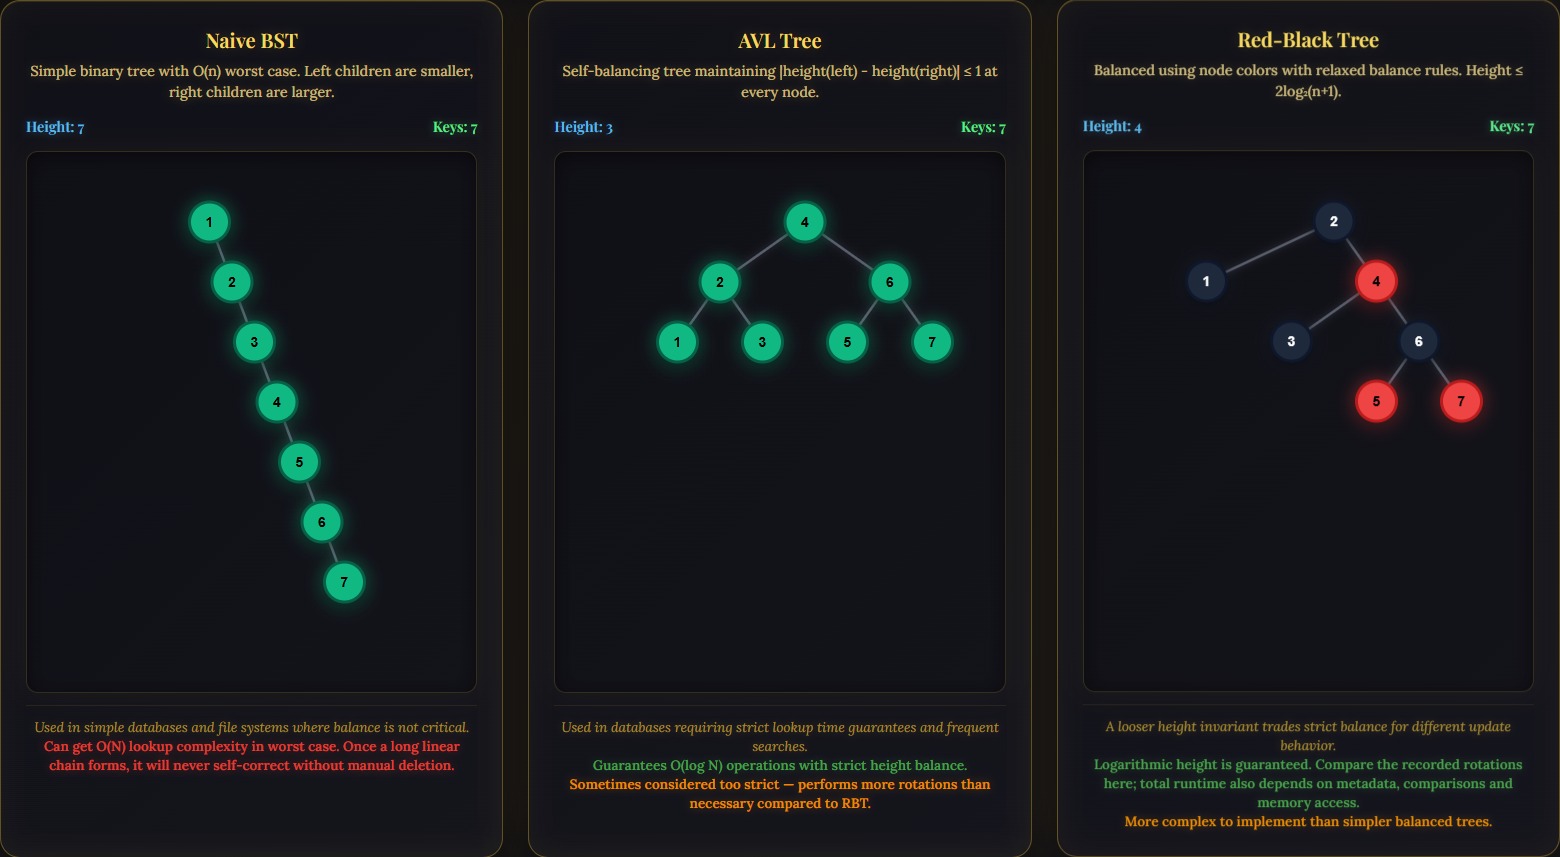
Open the application, then follow what changes
One ordered set, seven ways to maintain it. Run identical input through the trees and compare evolving shape, lookup depth and structural edits; the experiment isolates the local balancing choices later used inside larger algorithms such as Fortune's sweep.
-
01
Share the input
Give every tree the same ordered-set operations.
-
02
Apply the rule
Each structure restores its own invariants through local changes.
-
03
Compare the shapes
Watch paths, depths and structural differences emerge.
-
04
Read the costs
Interpret lookup depth and edit counts alongside the evolving tree.
A controlled comparison before a full application
The same keys isolate what balancing policies change. In Fortune, related trees have to maintain a moving beachline through geometric events. Here the geometry is removed so that rotations and structural choices are easier to see. This is the focused building block, while the geometry workbench supplies the demanding application.
Show what each rule changes
Each implementation records structural events alongside its own state. The view exposes rotations, red-black colors, treap priorities, and the multiple keys held by a 2–3–4 node. Height and mean successful node-visit charts compare the resulting shapes. Mean visits weights every stored key equally; a multiway node visit is not the same as a single key comparison.
The visualization has a common SVG path for binary trees and a separate layout path for 2–3–4 nodes and children. It computes subtree widths, places descendants, and adjusts the view to fit the resulting bounds. Keeping the multiway representation explicit preserves the algorithm's structure instead of forcing every implementation into an identical binary picture.
Interpret structural work carefully
The operation chart counts logged spins, splits, borrows, and merges. It gives a concrete view of how much restructuring accompanies the same insertion stream. Red-black recoloring appears in the event records but is excluded from this chart. Comparing the chart with the actual node arrangement makes that accounting choice visible.
A useful sequence is to compare a sorted batch with a random batch, then repeat an earlier range. Watch the unbalanced tree's shape, the balancing changes in the other structures, and the splay tree's movement toward the inserted or revisited value. This is a small instrumented study of implementation behavior: the diagrams and counters help explain what a balancing policy does on a particular input.
These are structural measurements, not frame-rate benchmarks. Treap guarantees are expected, splay guarantees are amortized, and AVL/red-black invariants differ; one generic “balance score” would hide those distinctions.
More recorded views · 2
Current scope
- The structural-event chart excludes recoloring and traversal work. It is not a timing benchmark or a complete accounting of implementation cost.
- The public interface currently hides its Delete control, so the exposed comparison workflow emphasizes insertion sequences rather than mixed insertion/deletion workloads.