About Me
I am a research-driven software engineer specializing in computer graphics and GPU-based simulation, with over seven years of experience in physically based rendering, shader development, and GPU pipeline architecture. My work spans both offline renderers and real-time systems, integrating academic techniques with high-performance, practical implementations across graphics, simulation, mathematics, and interactive visualization.
I see no rigid boundary between research, engineering, and art. Advanced techniques become meaningful to me only when they are transformed into concrete, interactive systems; and when rigorous internal design is paired with equally thoughtful visual presentation. I enjoy translating research ideas into robust, well-engineered implementations, repurposing techniques across domains to create expressive visual effects, and designing interfaces that make complex behavior intuitive rather than opaque.
Below is a curated selection of projects. They are organized by intent rather than difficulty alone, distinguishing between fully realized systems, experimental work, and projects that use visualization to build intuition and deepen understanding.
Featured Projects
My flagship projects where research ideas and engineering concepts are carried through to complete, working systems.
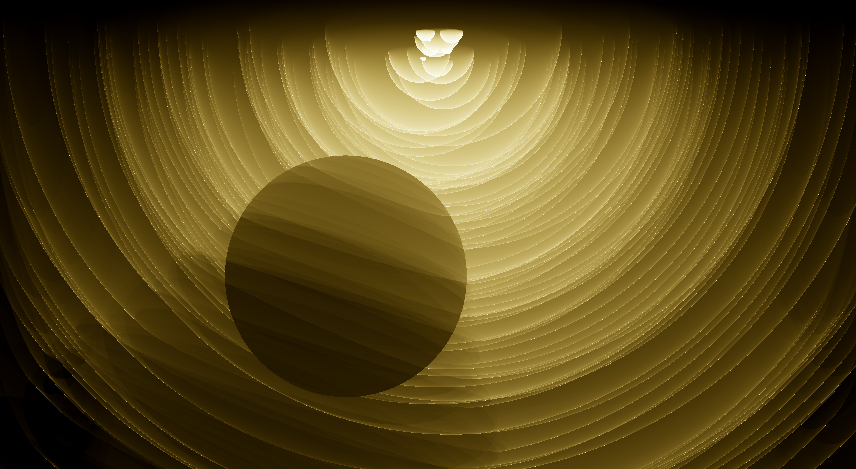
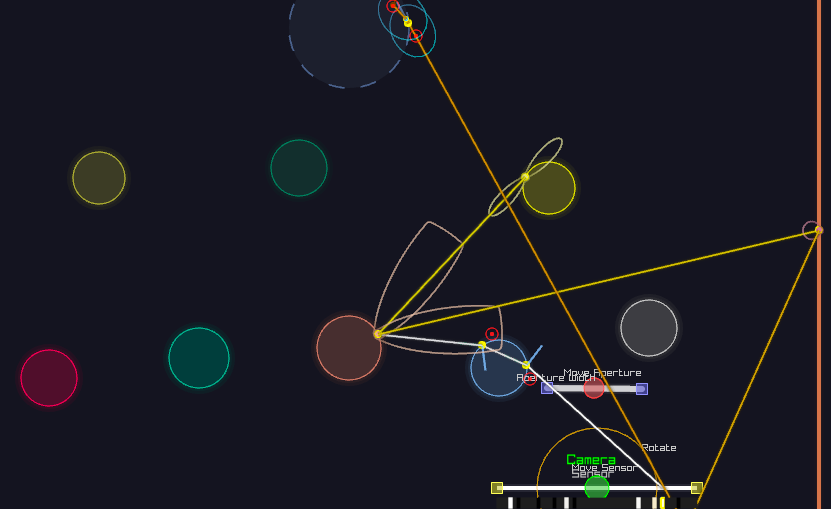
Advanced Photography Simulator: Real-time Path Tracing with Tilt-Shift Photography, Time-Gated Imaging, & Holography
A real-time , WebGL-based path tracing system pushing advanced offline optics and imaging techniques into interactive execution. The system integrates tilt-shift optics with an arbitrary focal plane, full camera internals, time-of-flight sensing with temporal gating, end-to-end holography with depth reconstruction pipelines, spectrum render, and more. All effects are modeled within a unified light transport and sensing pipeline.
Note: First-time shader compilation can take up to 40 seconds; subsequent runs are instant.
- JavaScript
- Physically Based Rendering
- Monte Carlo Integration
- Tilt-Shift Optics
- Depth of Field
- Spectral Rendering
- Time-of-Flight Imaging
- Transient Rendering
- Holography
- Computational Imaging
- WebGL
- GLSL
- JavaScript
- Shader Compilation
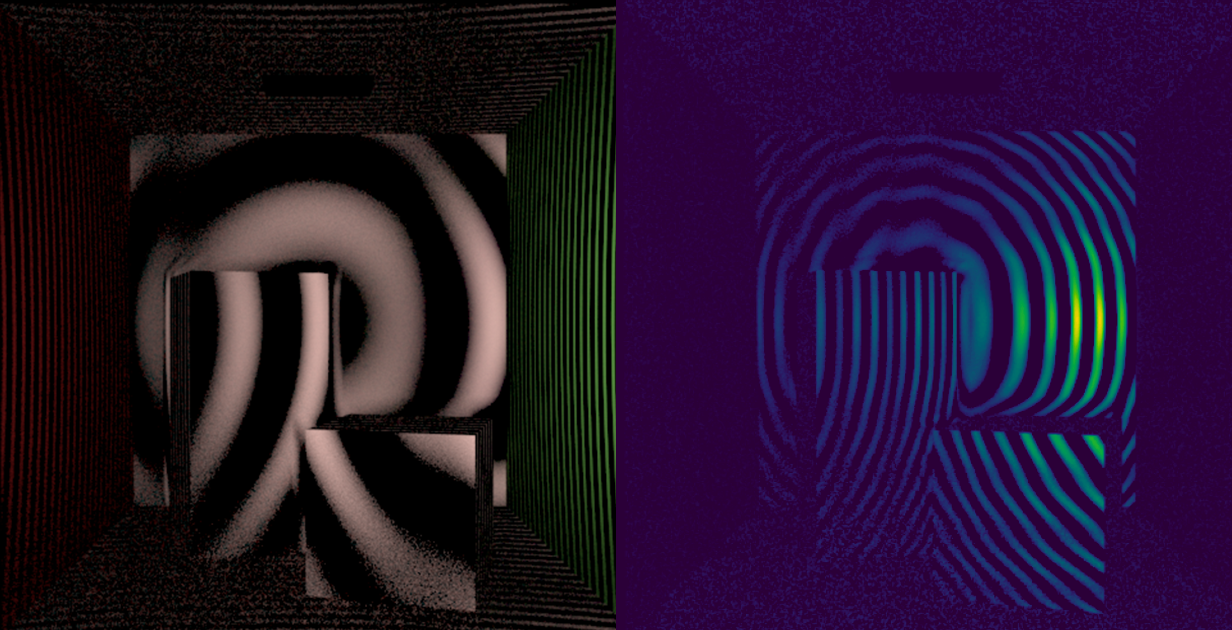
Off-Axis Holography & Depth Reconstruction in a Physically Based Path Tracer
A rendering-driven rethinking of off-axis holography. While off-axis setups are traditionally enforced through optical geometry, this project shows how equivalent holographic depth reconstruction can emerge from a physically based path tracer, enabling both multi-shot (traditional CW-Tof) and more importantly, single-shot reconstruction and extending naturally to advanced scattering control. In theory, this setup can also work in real life.
Beyond its research value, the resulting effects are difficult to match with synthetic approximations in games and interactive graphics, illustrating how directly modeling the underlying mechanism can yield richer and more varied visuals than handcrafted post-processing.
- C++
- Time-of-Flight Imaging
- Off-Axis Holography
- Computational Imaging
- Phase Reconstruction
- Modulated Light Sources
- Modulated Sensors
- Monte Carlo Light Transport
- Path Tracing
- Multi-Scattering Suppression
- Inverse Problems
- Physically Based Rendering
- C++
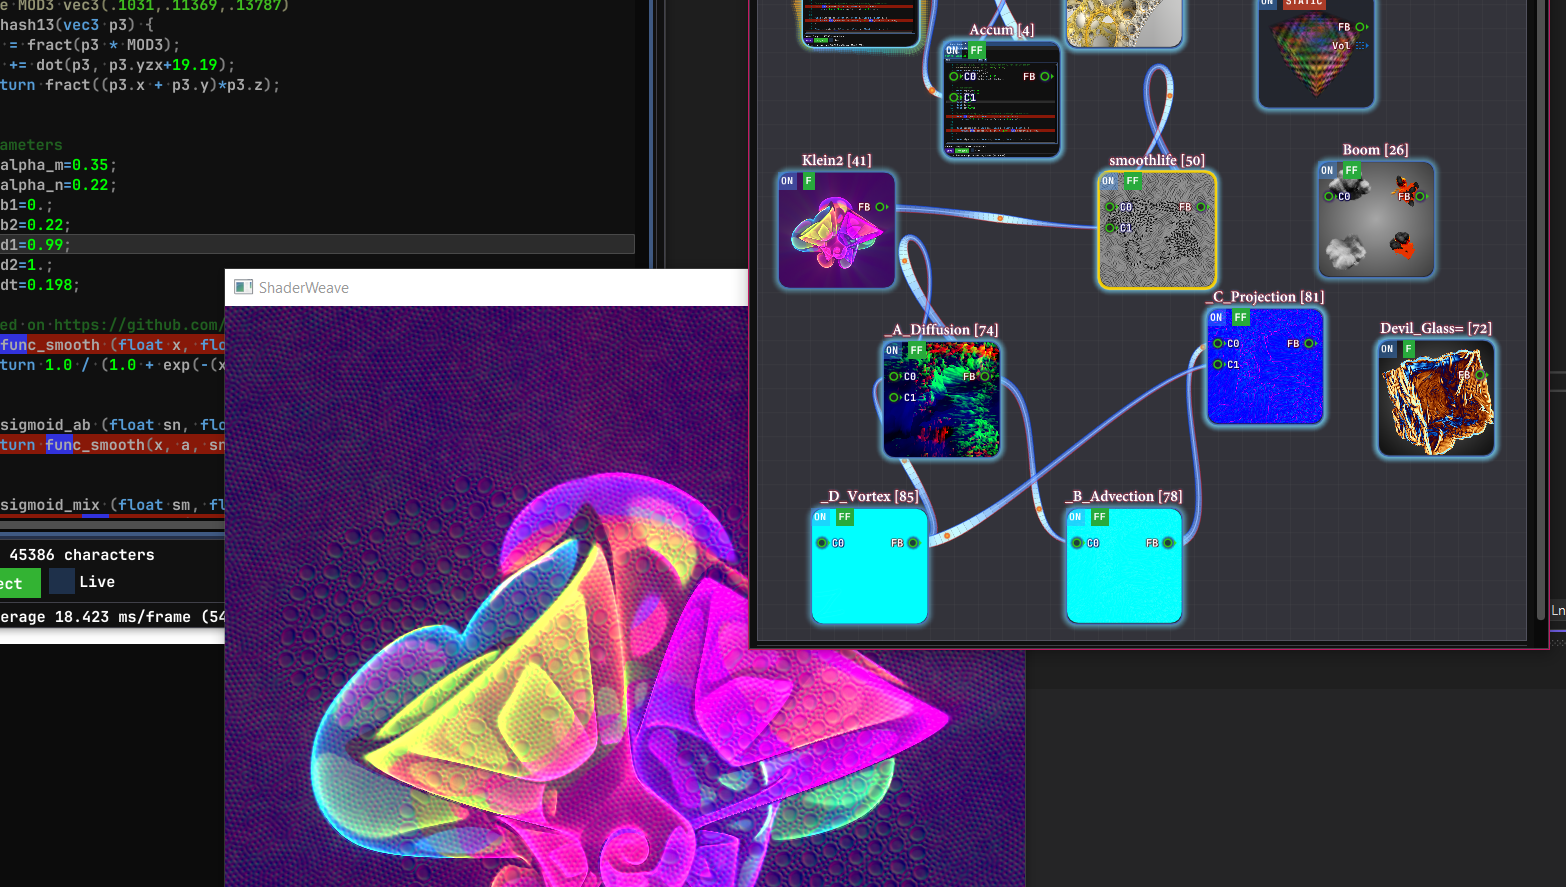
ShaderWeave: A Node-Based GPU Programming System
A fully C++ node-based GPU programming system with a polished interactive UI and live, hot-pluggable execution. It supports the full modern GPU pipeline including compute shaders and all programmable stages, as well as CUDA JIT and Optix, all under a unified framework, enabling complex feedback circuits and simulation workflows with arbitrary topology.
The system is designed for frictionless extensibility: shaders and resources become nodes automatically, requiring no manual integration or boilerplate. It also provides automatic code injection, allowing a shader to be written once in a familiar style (e.g. ShaderToy) then both executed immediately and expanded into a second version with all built-ins made explicit for inspection and easy porting.
- C++
- Shader Systems
- GPU Pipelines
- GLSL
- Compute Shaders
- CUDA Interop
- Code Generation
- Graph Compilation
- Dependency Resolution
- Hot Reloading
- Rendering Architecture
- ImGui
- C++
Photon Primitives: A Unified Framework for Unbiased Photon Mapping
A long-running line of work rethinking light transport as the decomposition of illumination into weighted primitives. By establishing a duality between sampling strategies and primitives, the framework bridges rasterization and ray tracing, naturally handling hard transport phenomena such as caustics, while allowing bias to be introduced deliberately for efficiency.
This reframing opens a visually rich and largely unexplored space, particularly for expressive and non-photorealistic rendering. Different choices of primitives and estimation modes (analytic or stochastic, correlated or uncorrelated) produce distinct intermediate structures: ranging from coherent visible primitives to fully uncorrelated Monte Carlo estimates, while converging to the same final result.
- Photon Mapping
- Light Transport
- Sampling Theory
- Rendering Primitives
- Unbiased Rendering
- Biased Rendering
- Participating Media
- Caustics
- Stylized Rendering
- Ray Tracing
- Rasterization-Ray Tracing Hybrid
- Monte Carlo Methods
- Rendering Research
- C++
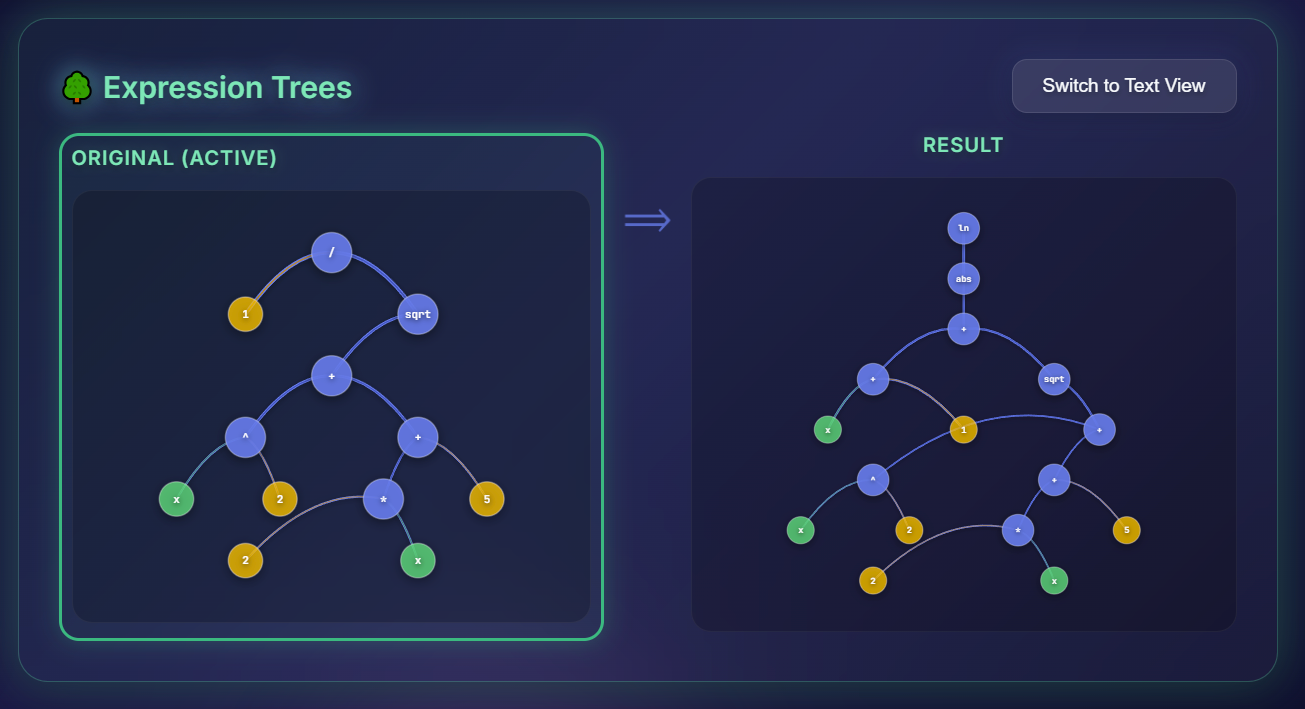
Rule-Based Symbolic Math Engine Built from Scratch
A symbolic mathematics engine built from scratch in Ruby, developed incrementally from a symbolic differentiation tool into a system capable of performing non-trivial symbolic integration on multivariate expressions. Expressions are represented as structured trees, enabling precise algebraic manipulation and controlled transformation.
Rather than relying on closed-form guarantees like Risch’s algorithm, the engine approaches integration as a heuristic-guided, search-driven process (similar in spirit to Monte Carlo rendering & game-tree search), exploring the solution space through rule-based algebraic transformations such as integration by parts, rational integration, substitution, and simplification.
- Ruby
- Symbolic Computation
- Computer Algebra Systems
- Expression Trees
- Rule-Based Systems
- Symbolic Differentiation
- Symbolic Integration
- Integration by Parts
- Rational Integration
- Algebraic Simplification
- Abstract Syntax Trees
Fortune's Algorithm in Crystal: Implemented Without Compromise
A complete, unsimplified implementation of Fortune's sweep-line algorithm for Voronoi diagram construction, preserving full geometric and structural complexity. This includes exact event handling, degeneracy resolution, and balanced beachline maintenance.
Code duplication is eliminated through deliberate exploitation of algorithmic symmetries. An introspective visualization exposes the full sweep-line event lifecycle, keeping circle events inspectable after invalidation, with color-coded temporal ordering and explicit geometric interpretation.
- Computational Geometry
- Voronoi Diagrams
- Sweep-Line Algorithms
- Event-Based Algorithms
- Balanced Trees
- Geometric Degeneracy
- Exact Arithmetic
- Algorithm Visualization
- Beach Line Data Structures
- Crystal Language
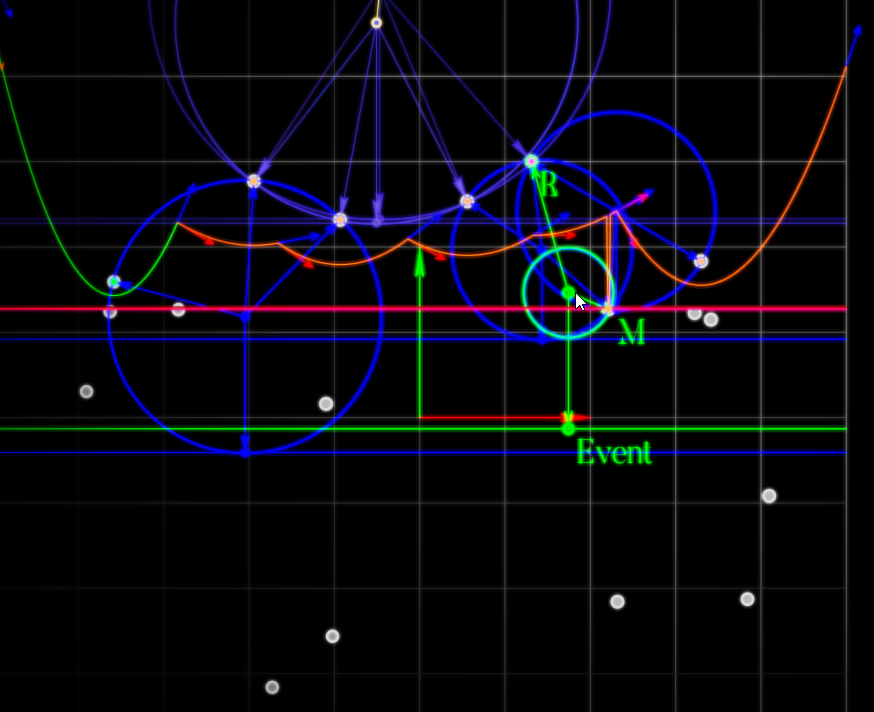
Tracer in Flatland: An Introspective 2D Path and Light Tracer
A fully functional 2D path and light tracer implementing Monte Carlo light transport with next-event estimation and participating media support. Unlike typical 2D visualizations, the system produces an actual 1D rendered image while exposing every stage of the light transport process. The reduced dimensionality is a deliberate design choice, enabling complete and non-overlapping visualization of light path construction in action, including BSDF sampling, geometric sampling, shadow connections, and path contributions (including sensor importance), and a per-sample breakdown of sensor accumulation, making internal behavior fully observable for debugging and educational use.
- Path Tracing
- Light Transport
- Monte Carlo Methods
- Next-Event Estimation
- BSDF Sampling
- Sensor Importance
- Debug Visualization
- Dimensional Reduction
- Educational Rendering
- Ruby
Algorithmic & Mathematical Visualizations
Live & Interactive
I approach abstraction as something to be navigated rather than avoided. This section is about making complex ideas — algorithms, mathematical structures, and related systems — feel intuitive by turning their structure or behavior into something you can directly interact with.
Teaching and mentoring experience shaped this belief: when what’s happening underneath is presented clearly and interactively, understanding follows naturally, without requiring prior specialization.
This section consists entirely of live, interactive projects. Some pieces focus on revealing internal mechanics; others explore alternative representations or perspectives on the same mathematical object. Together, they reflect a broader goal: to design visualizations that are clear and expressive enough that learning feels effortless, where curiosity is all that matters.
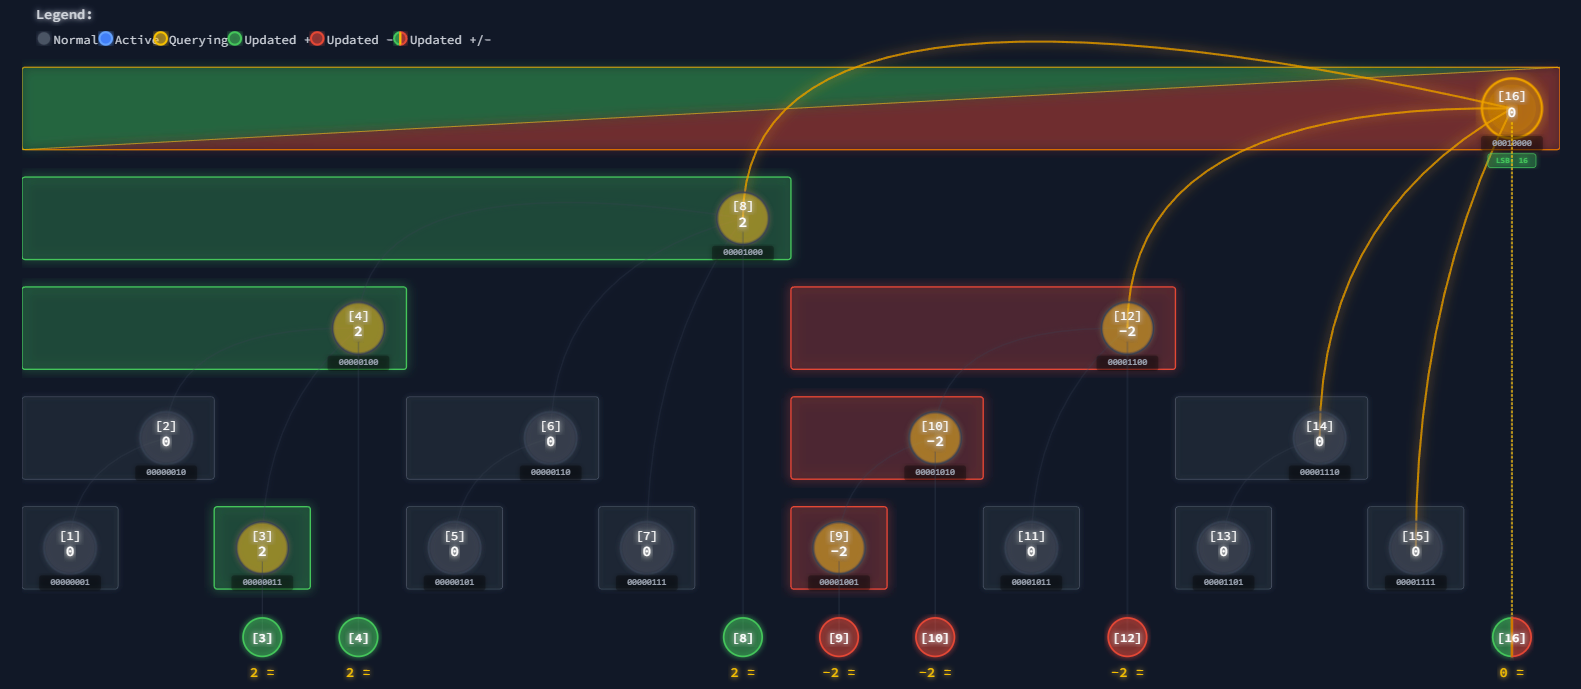
Fenwick Tree Visualizer
A comprehensive, step-by-step visualization of Fenwick trees, covering basic queries, range updates, range-update–range-query formulations, and 2D extensions. The system exposes prefix-sum invariants and tree structure directly, allowing every update and query to be observed as it executes, highlighting the structure and elegance of the underlying algorithms.
Beyond surface-level demonstrations, the visualization makes the underlying bitwise and gradient-domain structure explicit, using Gray-code adjacency to explain how updates and queries propagate through the tree.
- React
- Fenwick Trees
- Prefix Sums
- Range Queries
- Data Structures
- Algorithm Visualization
- UI Design
- React
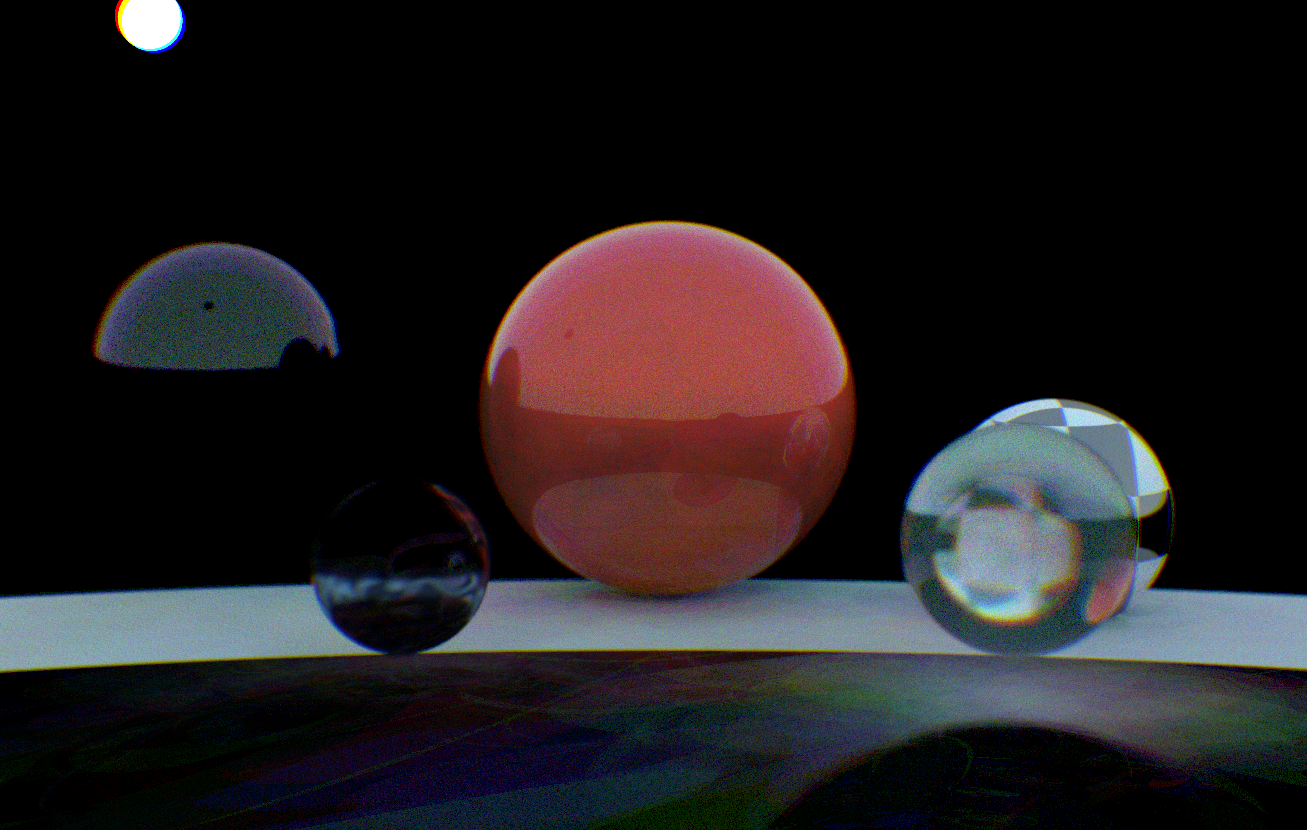
Particle-Based Geometric Optics with Wavelength-Resolved Light
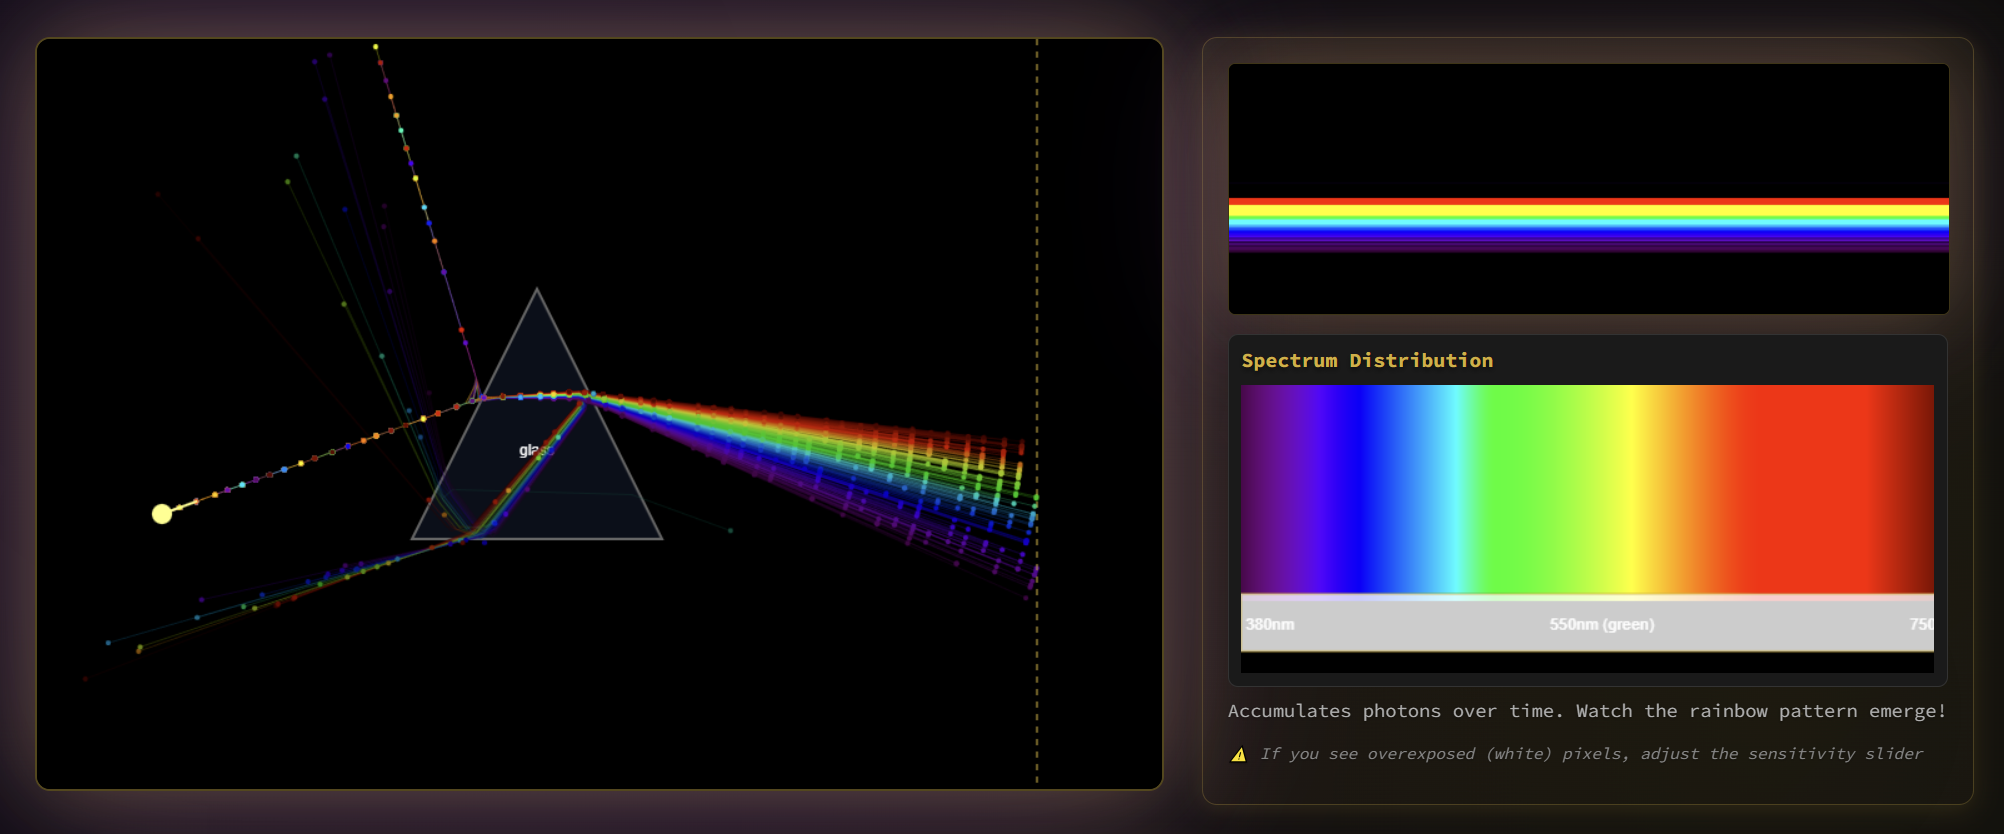
Developed from teaching assistant experience, this prism light-transport visualization adopts a Newtonian particle-based optics model, where probabilistic ray splitting enforces energy conservation at material interfaces. The system exposes Fresnel reflection and transmission and wavelength-dependent dispersion through wavelength-specific indices of refraction.
By isolating wavelength dependence at interfaces, the visualization demonstrates how many phenomena often attributed to wave optics can be explained using geometric and probabilistic optics alone.
- JS
- Geometric Optics
- Refraction
- Dispersion
- Ray Splitting
- Educational Visualization
Drawing with Harmonics: DFT, DCT, HHT, and STFT
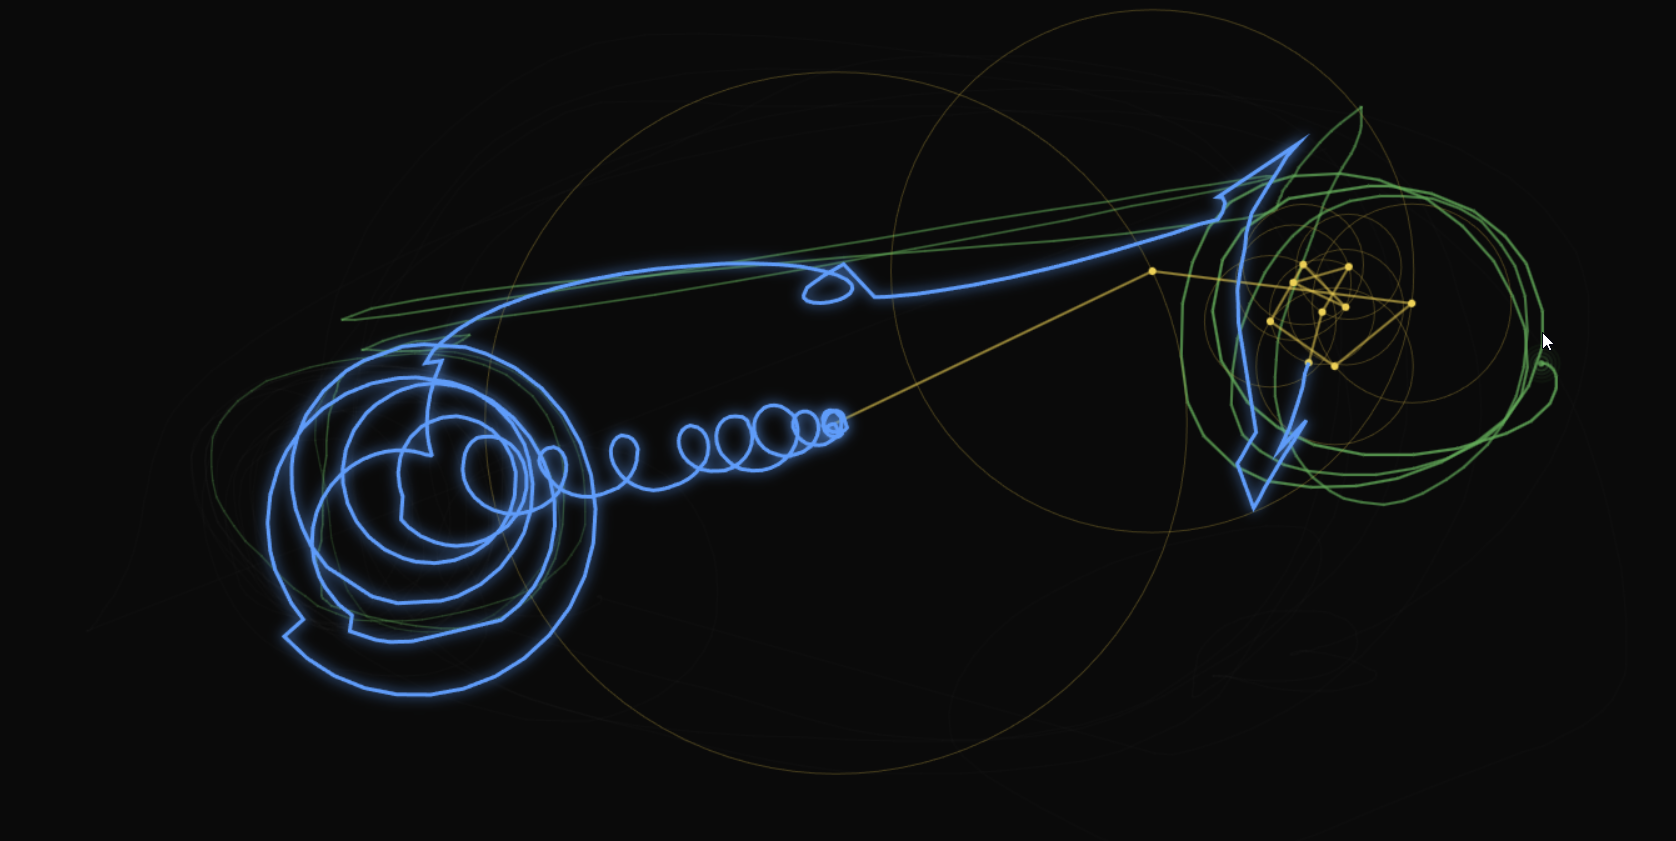
A visually driven system for constructing and reconstructing motion from harmonic components. The project combines global discrete Fourier and cosine representations with time-local analysis (STFT, capturing not only the curve but also the speed) and adaptive, data-driven decomposition (HHT), allowing both geometric structure and temporal behavior to be observed directly through motion.
- JS
- Discrete Fourier Transform
- Discrete Cosine Transform
- STFT
- Hilbert-Huang Transform
- Motion Reconstruction
Two-Mode Complex Function Visualizer
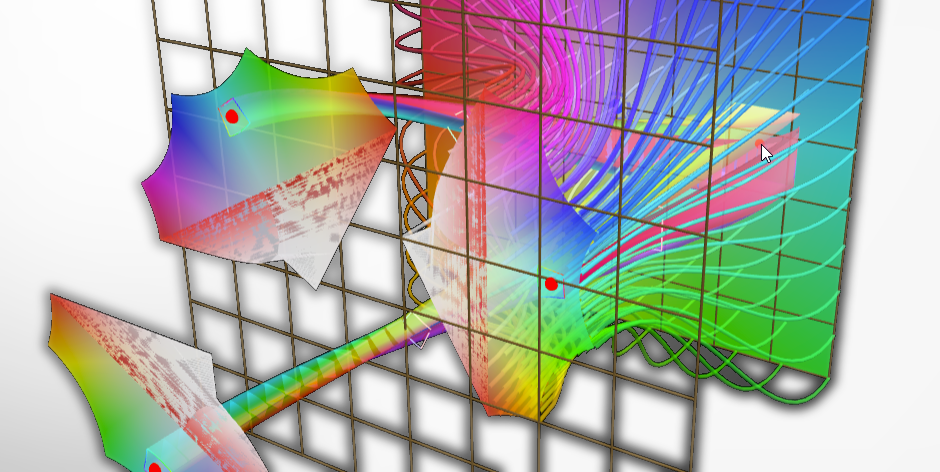
An interactive system for exploring multivalued complex functions through two complementary representations: a traditional Riemann surface view that makes sheet structure explicit, and a plane-to-plane mapping view enabled by direct interaction. While plane-to-plane visualizations are often dismissed as impractical in static settings, interactivity makes them effective for understanding bifurcation, branch splitting, and local shape distortion.
- JavaScript
- Multivalued Functions
- Branch Points
- Bifurcation
- Domain Coloring
- Complex Mapping
- Interactive Visualization
- JavaScript
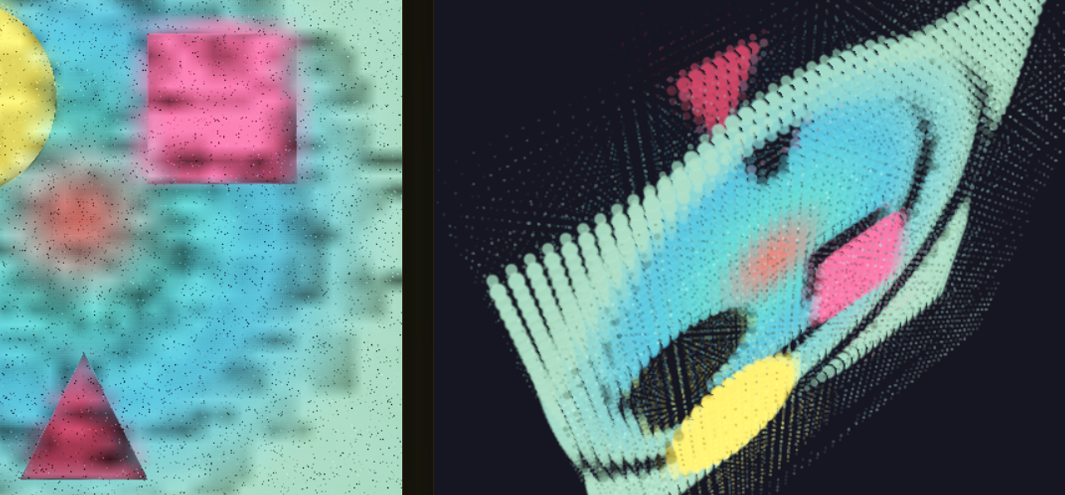
Image Processing Suite
A visualization-driven exploration of image processing algorithms, featuring a 3D visualization of bilateral grid filtering, exposing how edge-aware behavior emerges from its augmented spatial–range representation. It also includes a generalized Hough transform with custom templates, making parameter-space voting visible by projecting it back into the image domain, along with additional filters for context.
- JS
- Convolution
- Canvas API
- Image Processing
- Edge Detection
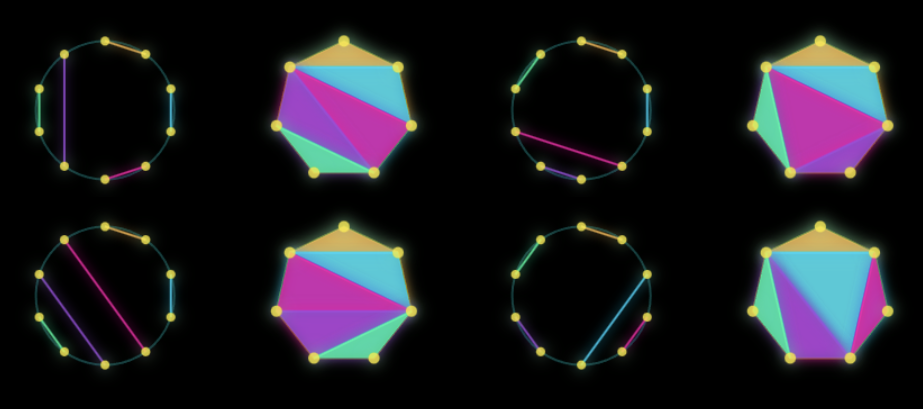
Catalan Numbers Explorer
A clean visual exploration of Catalan-number structures, emphasizing the shared combinatorial constraints behind seemingly different objects such as mountain ranges, binary trees, balanced parentheses, polygon triangulations, and more.
The focus is on showing intuitively how the value can be derived and what other quantities it relates to, while making the equivalences between representations explicit.
- React
- Combinatorial Structures
- Binary Trees
- Polygon Triangulation
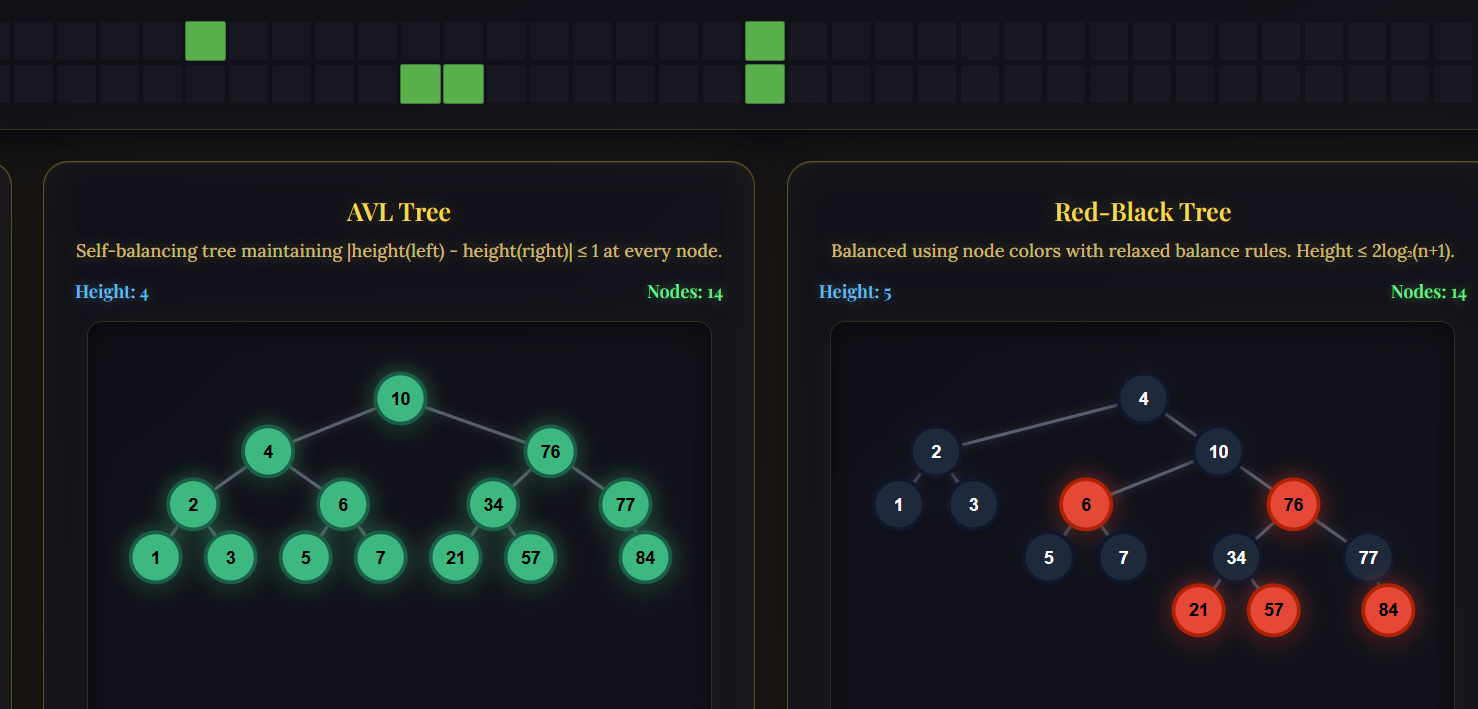
Seven Search Trees, Side by Side
Side-by-side visualizations of sorting algorithms are ubiquitous, but search trees — despite their equally ubiquitous use and algorithmic elegance — rarely receive the same treatment. This demo applies a comparative lens to seven search trees, making their balancing behavior and structural evolution directly observable.
By visualizing rotations, rebalancing, and structural mutations in parallel, the system reveals how different invariants shape runtime behavior beyond asymptotic bounds. Some trees enforce strict balance, offering strong worst-case guarantees but higher maintenance cost; others deliberately relax balance, trading theoretical guarantees for lower constant factors and faster behavior in common scenarios.
- JS
- Data Structures
- Binary Search Tree
- Size-Balanced Tree
- Treap
- Splay Tree
- 2-3-4 Tree
- Visualization
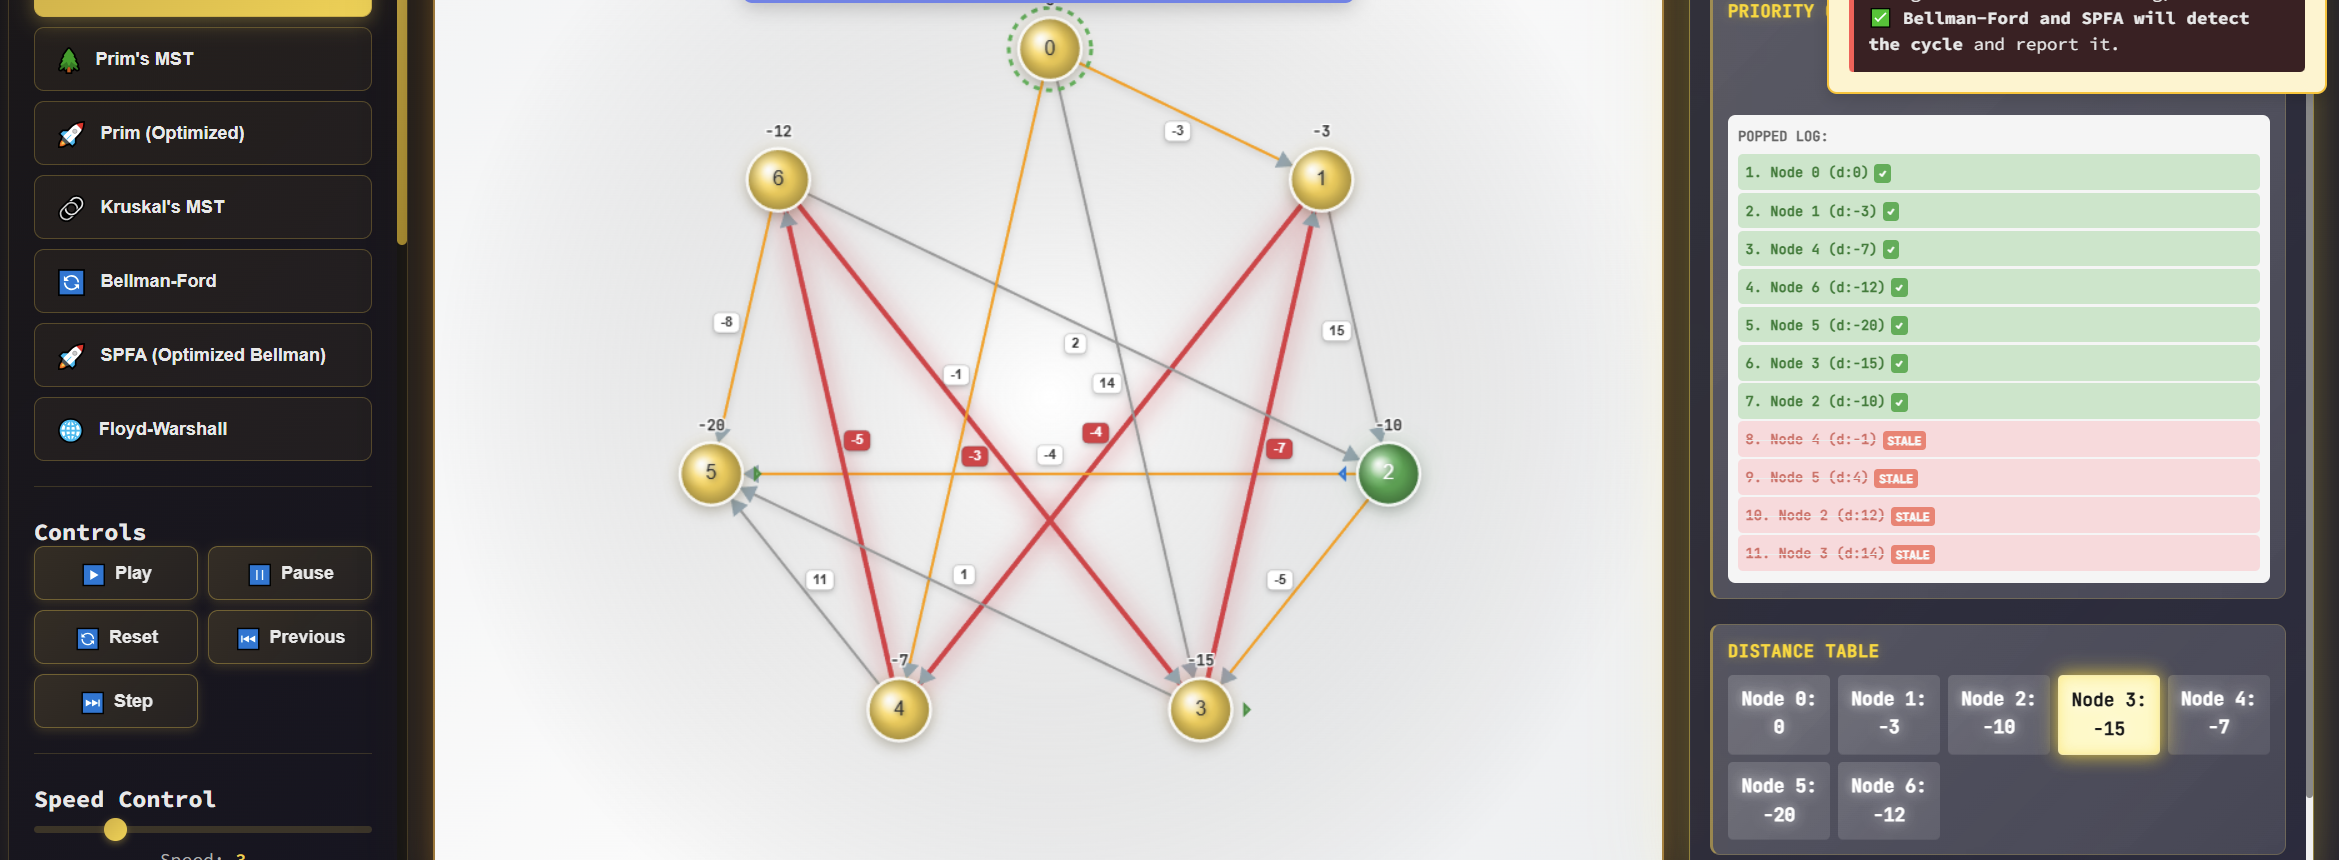
Graph Theory: A Comprehensive, In-Depth Visualization of Every Detail
A fully implementation-faithful visualization of graph algorithms, exposing the exact operations required for algorithmic correctness and asymptotic guarantees.
Where most demos collapse complex behavior into “magic” steps, this project makes priority queues, relaxations, and failure modes explicitly visible: revealing what must actually happen for stated complexity bounds to hold. Core algorithms are shown in multiple concrete variants (e.g. Bellman–Ford vs. SPFA), with step-accurate, color-coded structure that exposes both correct operation and known limitations.
The goal is exhaustive transparency: a reference-level demonstration of how graph algorithms actually work.
- JS
- Graph Algorithms
- Priority Queues
- Shortest Path
- MST
- Bellman-Ford
Experimental / Exploratory
These projects are open-ended investigations where the direction is more important than the destination. They explore new ideas, probe theoretical questions, and experiment with representations—treating development itself as a form of inquiry.
Implementations and theory may both be in early stages, with an emphasis on curiosity, play, and discovering what is interesting before deciding what is useful.
Note: These experimental projects are intentionally exploratory. The implementations and explanations are works in progress, reflecting ideas that are still being tested, refined, and restructured.
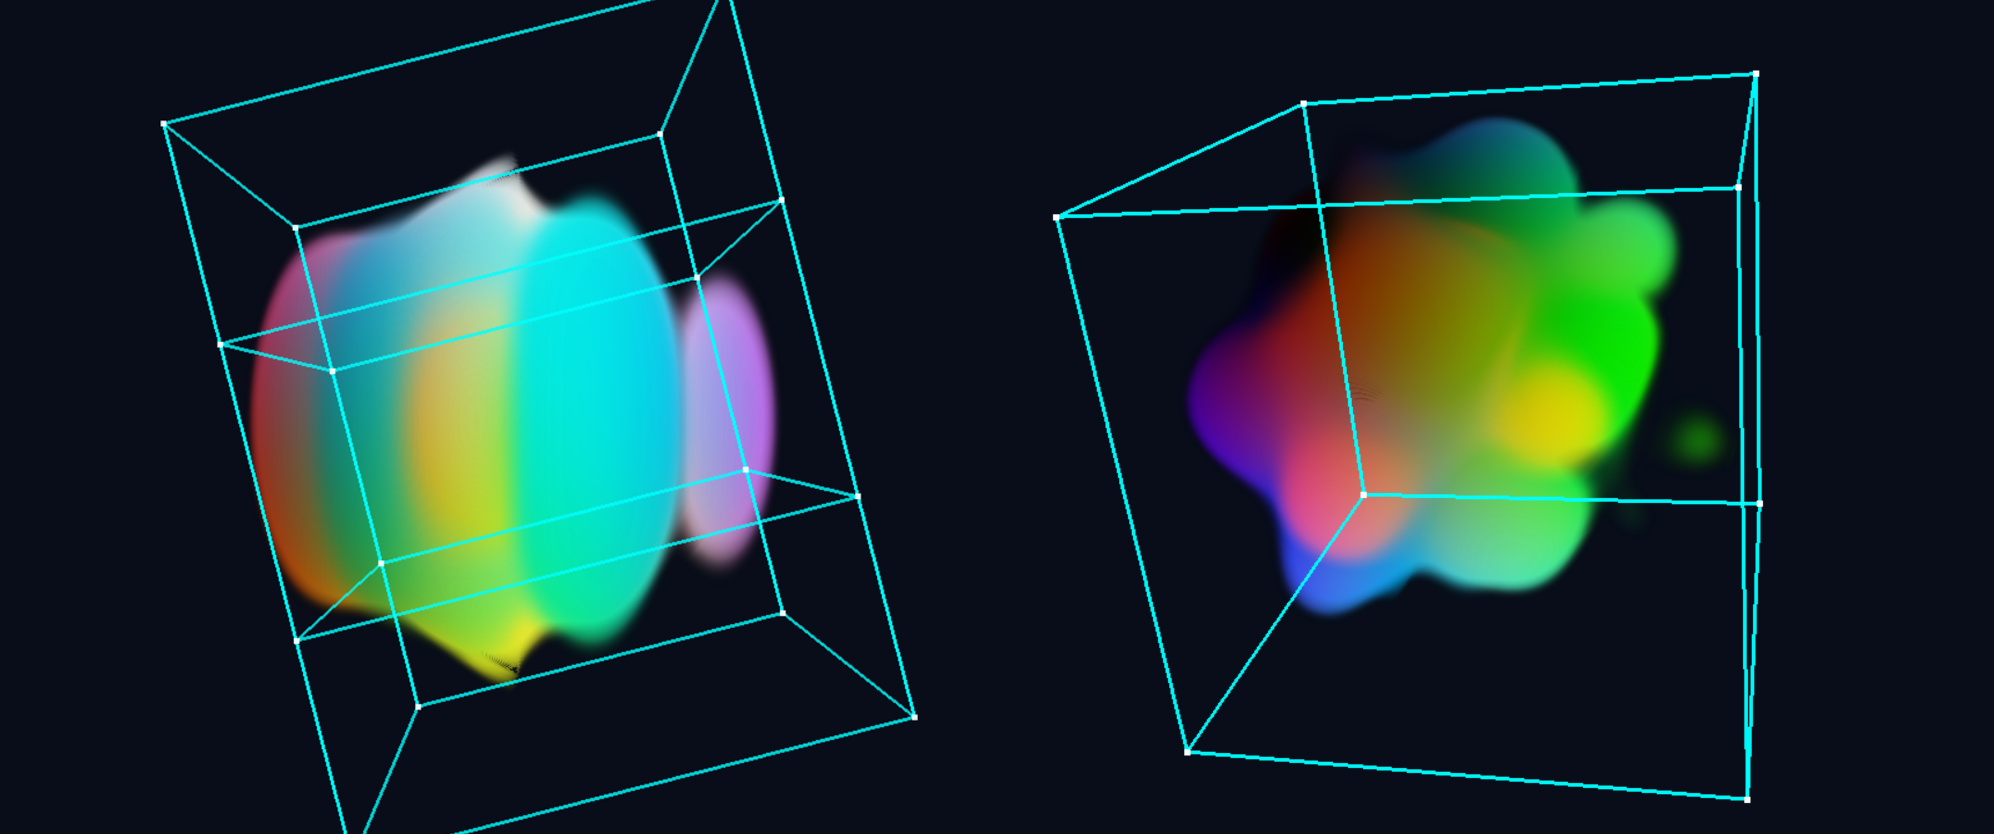
Exploring Representation and Evolution in Five Dimensions
The project explores how high-dimensional data can evolve through changes in representation. It begins with a procedural five-dimensional field, where spatial, temporal, and latent axes are treated symmetrically and mapped to color. Distinct views are formed through slicing and projection, and visualized via ray marching.
Fixing temporal and latent dimensions yields a concrete 3D field, but the act of viewing introduces new degrees of freedom. In this sense, representation shifts from xyzwt → RGBA to xyz + view direction → RGBA, effectively trading latent dimensions for angular ones.
NeRF-style neural representations are used here as a resampling mechanism, providing continuous values over the resulting domain. This allows representation changes themselves to be treated as a mechanism for evolution and iteration in high-dimensional spaces. In parallel, Taichi-based diffusion dynamics are explored as another path for introducing evolution and feedback.
- Python
- Taichi
- High-Dimensional Fields
- Procedural Volumes
- Implicit Functions
- Ray Marching
- GPU Compute
- Taichi
- Python
- Non-ML Volumetric Methods
- NeRF-Inspired Representations
- Slice-Based Visualization
- Exploratory Rendering
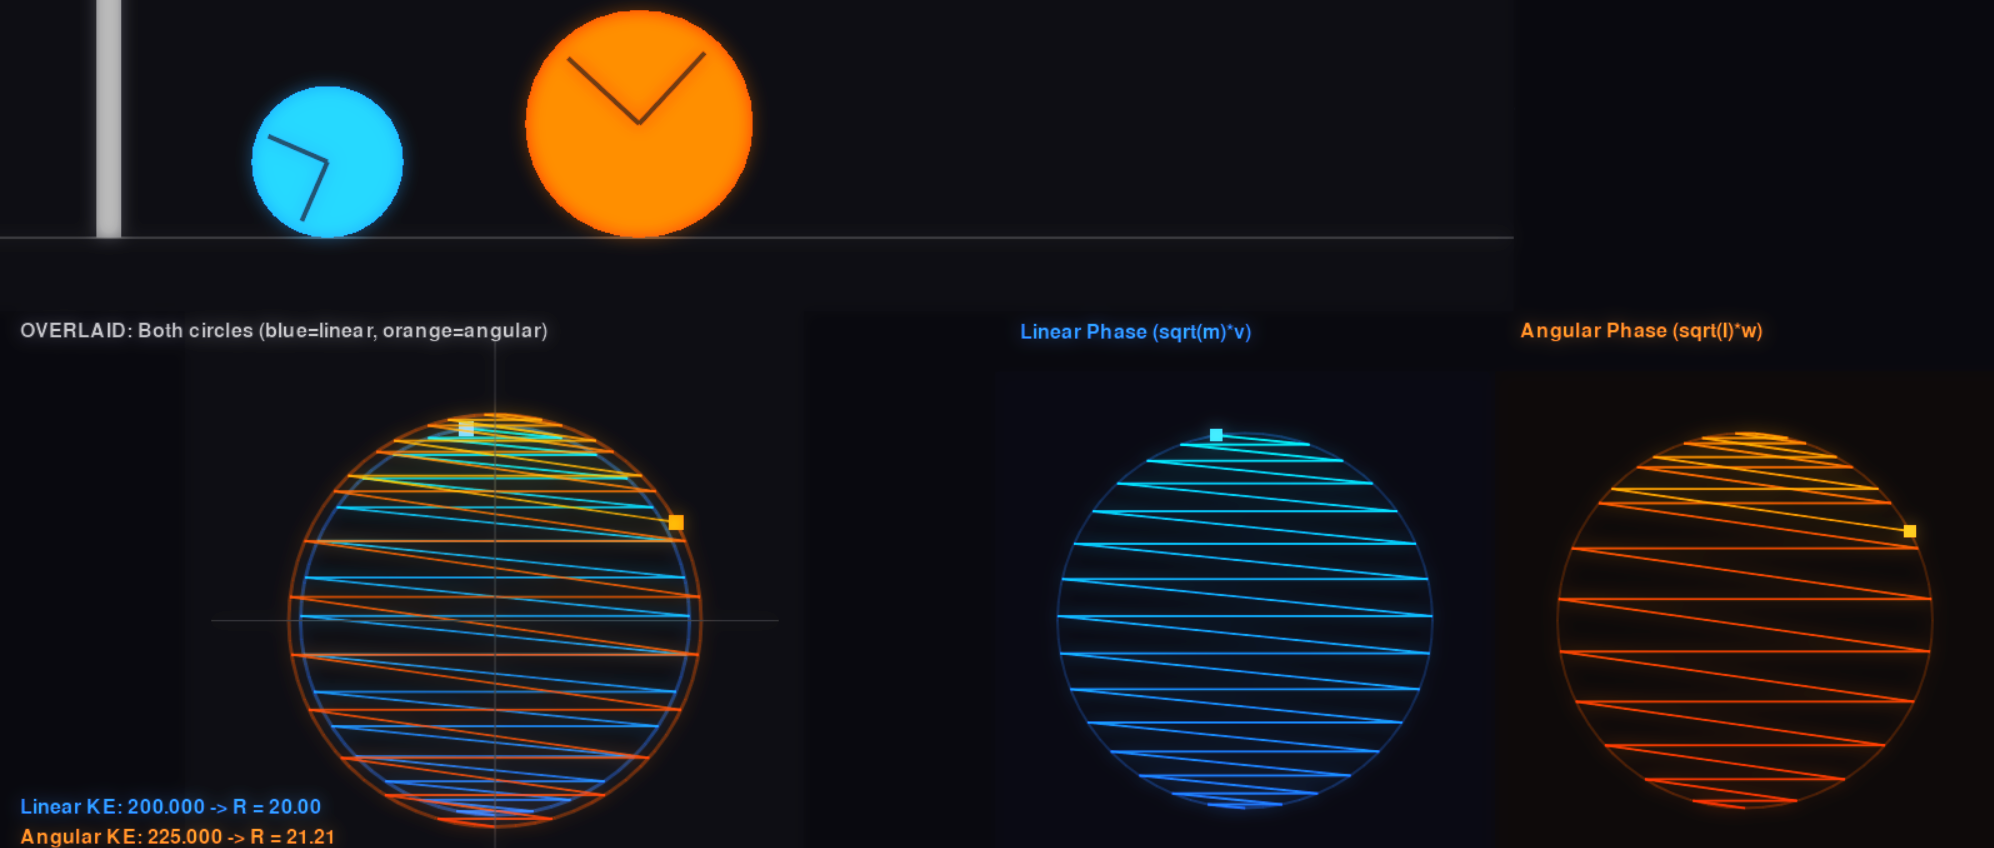
Mechanical Computing: How π Can Emerge from Physical Systems
Building on the core insight of 3Blue1Brown’s collision-based construction of π — where a simple elastic system encodes π through collision counting — this project treats physical motion as a computational medium and explores increasingly general and sophisticated forms of mechanically encoded numerical invariants.
Simple variations — such as switching between linear and angular momentum — produce equivalent behavior by preserving the same circular phase-space geometry. More complex setups extend this idea to three-body systems, coupled linear–angular dynamics, and even 4D phase spaces with hyperspherical trajectories, testing how robust the phenomenon remains under added geometric and dynamical complexity.
A complementary formulation replaces discrete collisions with mechanical wave dynamics, expressing the same structure through continuous propagation and connecting the system to familiar Fourier and spectral viewpoints. Ongoing experiments explore more exotic mechanical encodings to probe the limits of mechanical computation.
- Classical Mechanics
- Elastic Collisions
- Phase Space
- Invariant Quantities
- Mechanical Computation
- Dynamical Systems
- Visualization
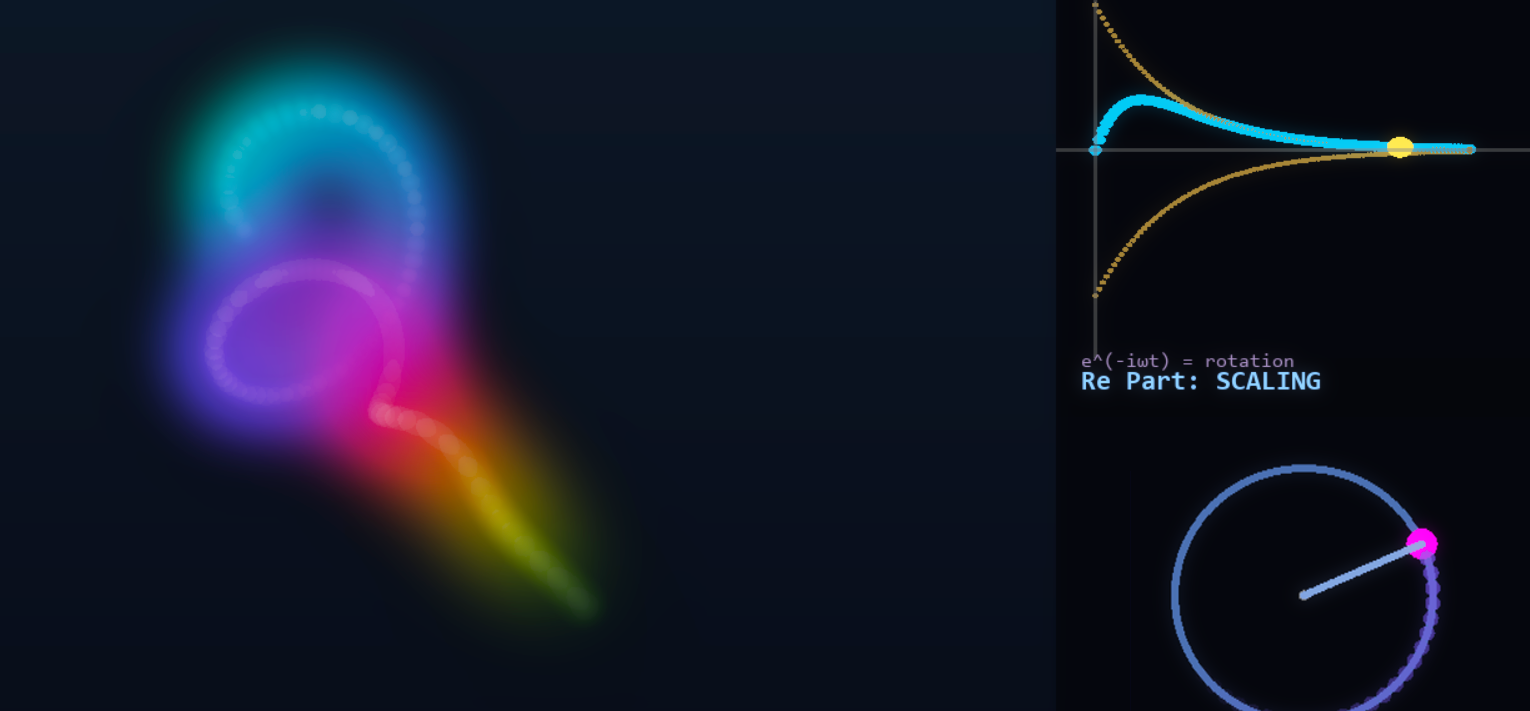
Laplace Transform Visualizer: Filling the Intuition Gap
An exploratory visualization project aimed at building geometric intuition for the Laplace transform, which becomes less intuitive than Fourier analysis as dimensionality increases.
While Fourier transforms admit natural interpretations through rotating vectors and periodic motion, Laplace transforms introduce growth, decay, and complex scaling that are harder to visualize. This project experiments with interactive visual mappings to reveal how structure in the time domain is reflected in the s-domain, beyond standard contour or pole–zero plots.
In addition to existing approaches, the system explores interpretations such as treating Laplace as a Fourier scanline across the complex plane, and generalizing the familiar rotating-vector (“spinner”) model to arbitrary complex scaling. This perspective hints at connections to polarization-like behavior, offering a more continuous and physical intuition for Laplace-domain structure. The visualization also presents a global operator view, evaluating the transform over a grid of complex s-domain parameters to reveal the combined effects of oscillation, decay, and amplification in a single view.
- Python
- Integral Transforms
- Differential Equations
- Frequency Domain
- Complex Analysis
- Mathematical Visualization
- Exploratory Interfaces
- Ruby
Techniques & Topics
A visual summary of techniques and concepts demonstrated across the projects shown on this page.